1. Initial Visit Interaction to Determine the Worst Years
1.1. Background/Objectives
In this section of the initial visit, farmers will identify the worst years and they will discuss the reasons why the years were the worst. During this exercise, farmers will name the worst 8 years (that they can remember) in the past 31 years for their main crop. This exercise will be used in conjunction with the initial visit materials, where index insurance concepts are introduced through educational games and discussions with the design team.
1.2. Instructions for facilitators
1.2.1. Preliminary preparation
List of suggested supplies
- Chalkboard/dry erase board/ flip chart
- Markers/chalk to write on the board
- Several different types/colors of post-its
- Paper and pen for the facilitators to record the results of the exercise
- Facilitators instructions and Worst Year Questions
Note: if the facilitators cannot use the suggested supplies in the field, some of these items can be replaced by more basic objects. As an example, the years might be represented by 15 boxes placed on the ground and the post-its can be replaced by beans or leaves of different colors. If facilitators find particularly effective tools, please let us know so that we can mention them in the materials.
Before starting, the facilitator draws a table on the whiteboard/chalkboard as follows:
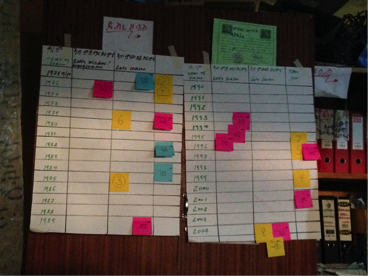
Farmers’ Worst Years Chart
Facilitator should go over the game instructions as set out below.
1.2.2. Exercise instructions
Note: As long as you collect all the information required (questions listed below), you can modify the exercises depending on the community, and your knowledge of local cropping practices. For example, in some communities you might have a lot of previous knowledge and the exercise will take less time. In communities, where you really need to collect information on worst years, timing and impacts, you will need to spend more time going through the exercise.
- Assign participants in groups of 4-5 people (keep the same groups from the index insurance educational game). At least one person in each group should be able to read/write (can be a farmer or an assistant). Provide each group with several post-its of the same color (or other objects suitable to use in the field). Each group should have 3-6 post-its.
- Ask each group to select a representative who would be responsible to place the post-its in the appropriate place on the board once the group reaches consensus on the worst 3 years.
- Discuss with the farmers and agree together on a crop (or several crops) that they would like to use the insurance for. Some crops might not be suitable for an index insurance product (e.g. vegetables). In the interactive exercise ask farmers to identify years that were bad for the selected crops. Ask the participants to identify which years were bad in the early and late season.
- Explain to each group that this is an interactive exercise where participants in each group must discuss which years were the worst, based on their experience and memory. Ask each group to discuss and identify the 8 worst years. The eight worst years will be represented by the post-its each group receives (or other objects that groups receive). The groups should rank the worst years (with the worst year being 1). Remember to designate the elected group representative to lead the discussion.
- Give the groups 30 minutes to decide on the worst 8 years.
- Now, ask the group representative to walk to the chart and place the post-its next to the worst years decided by his/her group.
- After all groups have placed all their post-its on the Farmers’ Worst Years Chart, compare the years reported by the different groups. If there are differences, give the participants a chance to discuss in one big group until they reach agreement on 8 common worst years in the last 30 years for their village.
- Groups will also have to specify if the rainfall was particularly low at the start or at the end of the season. The facilitator can give an example like: “If you had the worst year for your main crop because of a drought, was the precipitation lower than usual in the early or the late part of the rainy season?”
- From all the years that the farmers listed, select the years for which there was strong disagreement between the farmer groups, and discuss the effects of the worst years until consensus is reached.
- Make sure to take pictures of the worst years chart. Take notes on farmers’ feedback.
1.3. Worst Year Questions
- What are the primary crops cultivated in the community? List below with estimated growing season for each.
- What were the worst 8 years (for your main crop) that you can remember? List them in order starting with the worst one.
- What caused the worst 8 years that you can remember (i.e. drought, hurricane etc.)?
- List the causes for each of the eight years
- In which phase of crop development did the events occur (i.e. flowering, planting etc.)?
- During which month of the year did they occur (i.e. January etc.)?
- How frequently do bad years tend to occur (e.g. every 4 yrs)? Is there any pattern in the occurrence of these events?
- In the years listed above, did you have access to climate information that helped you take action (e.g. traditional forecast methods, met service/weather report, recent trend of more frequent droughts)?
1.4. Effects of the Worst Year Questions
- How did it affect the farmers? List the different effects.
- How did it affect the community (ex. migration in search of work)? List the different effects.
- Who did it impact the most (what types of families, which local areas, etc.)?
- How did it affect families? Did it affect women differently than men? How did it affect the role of women in the family?
- During the worst year that you can remember, what actions did you undertake ahead of time to reduce the impact of climate events?
- Did the government help you in the worst year? Did anyone else help you in the worst year? Who?